 Example #1: Osmolar Gap

I'm a bit skeptical of the value of screening toxicology patients by measuring an osmolar gap. So I looked for literature about the test's performance. Lynd 2008 found that an elevated osmolar gap had a sensitivity of 90% and a specificity of 22% (1). That's about what I might have guessed – the test is fairly sensitive and very poorly specific (it can be elevated due to a panoply of substances). So, it's probably a reasonable screening test to rule-out toxic alcohol ingestion, but not as a diagnostic test to rule-in toxic alcohol ingestion.
Wrong. Based on 90% sensitivity and 22% specificity, the test has a positive likelihood ratio (+LR) of 1.15 and a negative likelihood ratio (-LR) of 0.45. These are weak likelihood ratios, of little help clinically. For example, suppose that we're trying to use osmolar gap to exclude toxic alcohol ingestion in a patient with a 10% pre-test probability. If the osmolar gap is normal, then the post-test probability decreases to 5%, which doesn't really rule this out.
Thus, looking at the sensitivity and specificity (90% & 22%) gives us an entirely different conceptualization of the test compared to looking at the positive and negative likelihood ratios (1.15 & 0.45).
Example #2: 90% sensitivity & 10% specificity
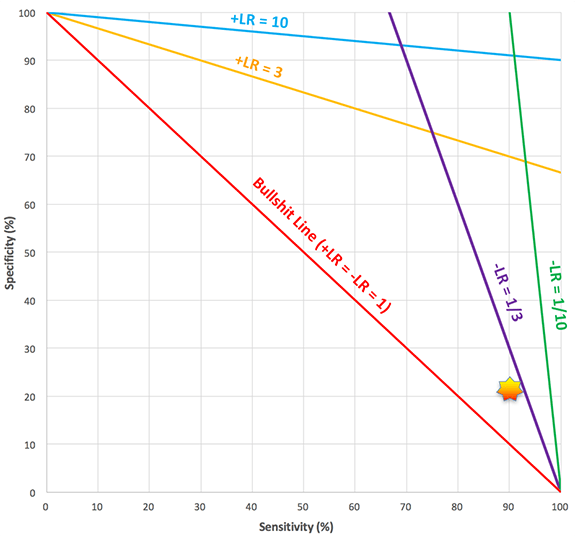
For the sake of argument, let's imagine that a diagnostic test had a sensitivity of 90% and a specificity of 10%. This may seem silly, but it's not that much different from the osmolar gap data above. What is the utility of this test?
You might be tempted to say that the test has a reasonable sensitivity, so it could be used to rule-out disease. Nope. In fact, this test has a positive likelihood ratio of 1 and a negative likelihood ratio of 1. The test is completely worthless.
The figure below illustrates why this happens. Let's imagine that a woman has a 50-50 pre-test probability of having a disease. The test result is negative. However, a negative test result is equally likely whether or not she has the disease. Therefore, her post-test probability is unchanged at 50%.
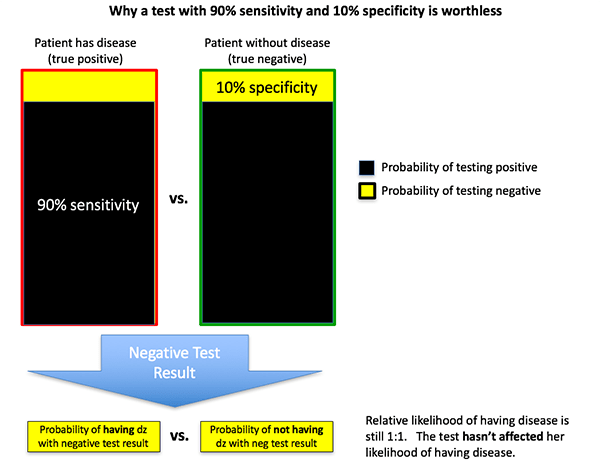 Taking this a step farther, any test where the % sensitivity plus the % specificity add up to 100% will be a worthless test (+LR = -LR = 1). In this situation, either test result (positive or negative) has the same probability of occurring whether or not the patient has the disease. For example, a test with 75% sensitivity and 25% specificity is worthless. We will return to this concept of bullshit tests later on.
Mythbusting SPin & SNout
We've been taught in statistics that the sensitivity of a test determines its ability to rule-out disease, whereas the specificity of a test determines its ability to rule-in disease:
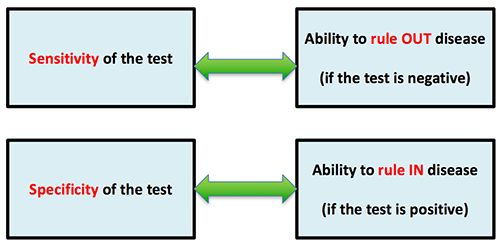
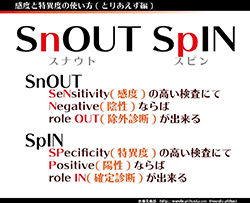 This is often taught with the mnemonic SPin and SNout (for SPecificity-rule-IN, SeNsitivity-rule-OUT). This concept is so widespread that the mnemonic is even popular in countries where English isn't the primary language. Unfortunately this is wrong.
- Sensitivity is the probability of a positive test within a group of patients who have the disease.
- Specificity is the probability of a negative test within a group of patients who don't have the disease.
Thus, sensitivity & specificity predicts whether the test will be positive, given that the patient either has or doesn't have the disease. This is the exact opposite of what we're interested in. What we need to know is whether the patient has the disease, given that the test is either positive or negative. Translating information from the test to information about the patient requires a likelihood ratio:
 In short, sensitivity/specificity are more test-centered, whereas likelihood ratios are more patient-centered. Fortunately, it's easy to calculate likelihood ratios from sensitivity and specificity using the following formulas:
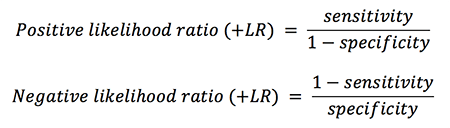 Likelihood ratios measure the test's true ability to rule-in (+LR) or rule-out (-LR) disease. From the equations above, it's clear that sensitivity and specificity both have effects on both the +LR and the -LR:
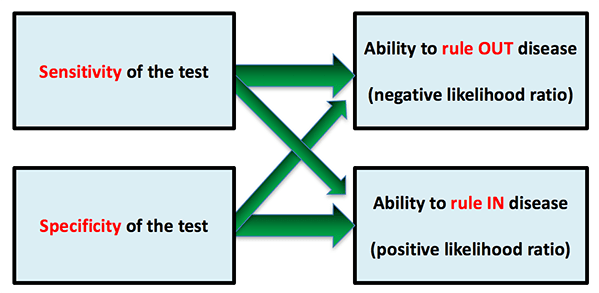 For example, the ability to rule-out disease is a function of both sensitivity and specificity. Sensitivity is a bit more important, but not by far. For example, even if the sensitivity is good (say, 90%), if the specificity is bad enough (say, 10%) then the poor specificity sabotages the ability of the test to rule-out disease.
For further proof that the SNout/SPin paradigm doesn't work, consider the following two diagnostic tests:
- Test #1: Sensitivity 90%, Specificity 70%
- Test #2: Sensitivity 30%, Specificity 90%
Which of these tests, if positive, provides stronger evidence that the patient has the disease? According to SPin, Test #2 has a higher specificity, and therefore it should be better at ruling-in disease. Wrong. Both tests have a positive likelihood ratio of 3. If either test is positive, it has exactly the same effect on the post-test probability.
Gross anatomy of diagnostic tests
Likelihood ratios may be more useful clinically, but sensitivity and specificity are more widely reported. Therefore, it is useful to gain a general understanding of how sensitivity and specificity translate into likelihood ratios.
This requires defining some general cutoff values for likelihood ratios. These are admittedly arbitrary, but they will give us some rough boundaries to work with (2):
- Weak impact: +LR between 1-3 or a -LR between 1-1/3
- Moderate impact: +LR between 3-10 or a -LR between 1/3-1/10
- Strong impact: +LR >10 or a -LR <1/10
This allows us to map out the relationship between sensitivity/specificity and likelihood ratios:
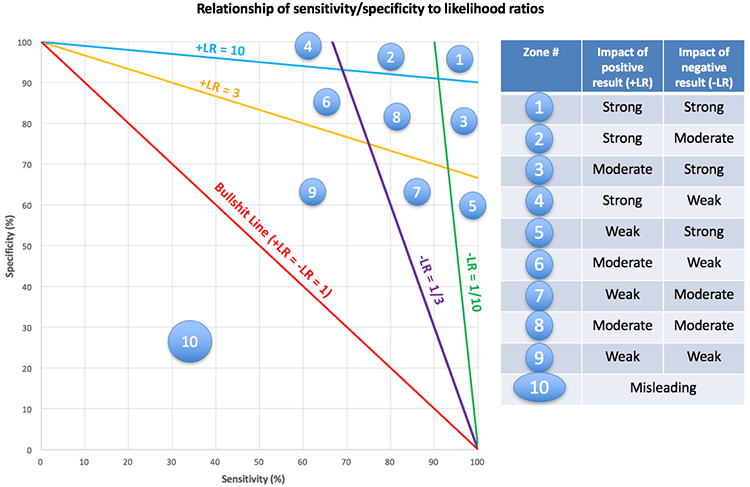 An interesting phenomenon occurs along the bullshit line. Any test lying along this line will have a positive and negative likelihood ratio of one, making it completely worthless. This phenomenon was explored earlier in example #2.
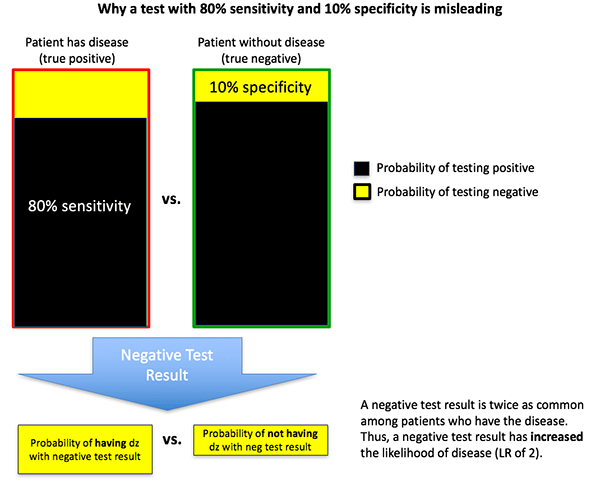
Below the bullshit line (in Category #10) something horrifying happens: tests actually become misleading. For example, let's consider a test with a sensitivity of 80% and a specificity of 10%. This test has a positive likelihood ratio of 0.89 and a negative likelihood ratio of 2. That's right: if the test is positive, it decreases the likelihood of disease. If the test is negative it increases the likelihood of disease. This test isn't just worthless; it's actively misleading.
How is this possible? Let's consider a man with a 50-50 pre-test probability of disease who undergoes a diagnostic test with 80% sensitivity and 10% specificity (figure below). The test comes back negative. It is actually more likely to get a negative test result if he has the disease (20%) than if he's disease-free (10%). Therefore, a negative test result will increase his probability of having disease from 50% to 67% (3).
 Returning to our initial example of the osmolar gap, with a sensitivity of 90% and specificity of 22% it will fall into a weak impact zone:
 It's eye-opening to realize how many tests with reasonable-appearing sensitivity or specificity will end up being worthless or weak. The figure below classifies tests into four groups depending on the strongest level of evidence that they can provide:
 Only tests falling along the very edge of this plot (green area) are capable of providing strong evidence. Most tests will end up providing misleading or weak results, which often occurs despite having a specificity or sensitivity >80%.

- Sensitivity/specificity reveal information about test performance, whereas likelihood ratios reveal information about the significance of a test result for an individual patient. As such, likelihood ratios are a more clinically relevant and patient-centered way to understand diagnostic tests.
- It is widely believed that the sensitivity of a test drives its ability to rule-out disease, whereas the specificity of a test drives its ability to rule-in disease. This is incorrect. Both sensitivity and specificity are jointly involved in the ability of a test to rule-in (+LR) or rule-out (-LR) disease.
- Despite having a high sensitivity (e.g. 90%), a low specificity (e.g. 10%) may destroy the value of the test, rendering it completely meaningless.
- It's possible to map likelihood ratios onto a graph of sensitivity vs. specificity, creating a visual representation of how sensitivity interacts with specificity to affect test performance (figure below). This illustrates how it is possible for tests with a high sensitivity or specificity (e.g. >80%) to be non-diagnostic or even misleading.
Notes
- There's a lot more to this paper and the question of osmolar gap, but this is a post about statistics. We'll get back to the osmolar gap issue later.
- These cutoffs are based on cutoffs which Steven McGee used in his landmark book on Evidence Based Physical Diagnosis (Second Edition). He argued that a cutoff of 3 or 1/3 was the boundary of clinical usefulness, because this would often shift the probability of disease by ~20%. This is a bit arbitrary. Regardless, I needed some sort of cutoff for this post and I didn't want to choose them out of thin air, so I used McGee's cutoffs. In reality, the best way to apply likelihood ratios with an individual patient is to consider the patient's pre-test probability of the disease, the likelihood ratio, the test threshold for the disease (the probability below which further testing is nonbeneficial), and the treatment threshold of the disease (the probability above which treatment is indicated and further testing isn't likely to change management).
- In practice, a test should never fall into Zone #10. It would take a considerable amount of oversight to allow this to happen, because the likelihood of a positive result is greater in patients without disease. If this scenario did occur, the test should be abandoned or the significance of a positive test result reversed, which would move the test out of Zone #10 probably into Zone #9. For example, in the case described here you could re-define the test so that a “negative” test was used to reveal the presence of disease. Re-defining the test in this way would give the redefined test a sensitivity of 20% and a specificity of 90%, with a +LR of 2 and a -LR of 0.89.

- PulmCrit Wee: Rational selection of infusion rate based on loading dose - June 25, 2024
- PulmCrit: PPIs are safe and effective for GI prophylaxis… the end. - June 18, 2024
- PulmCrit: Bilevel Sequence Intubation (BSI) – The new standard - June 17, 2024
Quite excellent Post as usual from Josh. Another weakness of the sensitivity and specificity and the AROC is its lack of consideration of time. This problem is greatest when the condition under test has no known time of onset such as sepsis. Take for instance a comparison AUROC of the absolute neutrophil count vs the AUROC band percentage for sepsis. This comparison is misleading because mature neutrophils demarginate better than bands in response to endotoxin so the band’s are left in the circulation as the mature neutrophils leave. Also mature nuetrophils are a limited resource so the number marginating and… Read more »
The accuracy of a lots of tests depend on the point at which they are ordered during the course of the disease e.g. troponin, rheumatoid factor.
Furthermore evaluating test performance requires a comparative gold standard that ultimately distinguishes ‘disease’ from ‘non-disease’. I am not sure all tests that we routinely use have been evaluated under those standards.
Of course, However with sepsis, unlike ACS, the time of onset is generally unknowable. Furthermore, in a common phenotype of bacterial sepsis, the absolute neutrophil count (ANC) and WBC first rises then often falls as sepsis worsens while the absolute band count and particularly the band percent rises as the WBC falls and then in some cases the IG (metamyelocytes) rises. Yet, while this is a common phenotype, this is NOT the time pattern of other phenotypes of bacterial sepsis. Also, during this time, the platelet count may rise, fall, or stay the same. However, if the platelet count falls… Read more »
Correction
My regrets. I meant to say mature neutrophils MARGINATE (adhere to the wall) and the leave the circulation better than immature neutrophils (bands).
Another important point is that the immature granulocytes from automated counters are myelocyes and more left and does not include bands and is therefore NOT a substitute for bands.
One more correction (sry)
Immature granulocytes (the IG on automated counters ) are Metamyelocytes and left.
Hello, I’m a by-stander who has some statistical/data science background, and has no medical training whatsoever. So please take what I’m about to say with that in mind, since I might be missing something in my knowledge that might change my mind. With that said, I’m wondering why you guys are considering just specificity or sensitivity or their complements, or a ratio between those values? Those metrics are known to be weak against skew in the class balance of the target variable (for example, population far more without the disease than with disease). You might miss out on an important… Read more »
Ack! Apologies for my mistakes:
* negative likelihood ratio -> LOW negative likelihood ratio
True positive given test: 100 patients
False positive given test: 1000 patients
True negative given test: 100,000 patients
False negative given test: 10 patients
Sensitivity = 100/(100+10) = 0.909
Specificity = 100,000/(100,000+1000) = 0.990
+LR = 0.909/(1-0.990) = 90.9
-LR = (1-0.909)/0.990 = 0.092
However:
Precision = 100/(100+1000) = 0.091 is very low
Hey stats person, this is great input. What you are describing is the exact situation we encounter when screening a population for a disease (e.g. mammography for breast cancer). The prevalence of disease is so low (which, using the law of large numbers, is equivalent to the pre-test probability for a randomly selected individual patient from the population about whom we know nothing more), so low that as you describe, even a test with great ROC results in low positive predictive value. In fact what you wrote is a classic medical school test question, where you are given ROC and… Read more »
Ah, I see. Thank you for patiently and politely explaining everything for me!
Josh also alludes to a way of using +/- LR when he mentions test and treatment thresholds. The idea is that for a given disease if the probability of a pt having it is probability of harm with remaining possibility of disease).. Alternatively, if the probability is > y, you’re done and say they have it (similarly, probability of disease is not 100, but probability of harm by not treating > probability of harm from treatment). In this explanation, ‘x’ is the test threshold (pre-test probability of disease determining if you test) and ‘y’ is the treatment threshold (pre-test probability… Read more »
Very nice. Thank you.
Here is Paulker’s seminal reference for threshold decision making (threshold science). This combined with the science of the ROC and the LR revolutionized testing,
https://www.ncbi.nlm.nih.gov/m/pubmed/7366635/?i=11&from=pauker%20%22threshold%20decision%20making%22
However, like most new enlightening scientific concepts the ROC and threshold science have been generalized as laws of nature and gained the staus of dogma. This reference shows why such concepts are too linear for many critical care and ER testing situations and become pitfalls when appied as dogma in the study or bedside care of the more complex dynamic relational conditions like sepsis
https://www.ncbi.nlm.nih.gov/m/pubmed/24834126/?i=4&from=lynn%20la
Daniel Kahnemann in Fast Thinking/Slow thinking that a necessary condition for expert intuition to become reliable is if events are sufficiently predictable such that patterns can emerge.
Are you arguing that sepsis is sufficiently unpredictable that in fact neither a simple score (SOFA) or an expert (such as yourself) can reliably respond to it in a rational fashion – nor can adequately explain the phenomena with a sufficient number of expert-derived heuristics.
No. it might be helpful to reread the LTE about dynamic diagnostic relationism for which I provided the link earlier. The original post by Josh provides one of the best presentations of the problems with consideration of sensitivity as meaningful in isolation. I simply extended that to provide a warning that the pattern of the time series of the biomarker under tedst in relation to disease progression or seventy must also be known. After Paulker, everybody was guessing thresholds to render their disease subject to dichotomization (the true state) for research using threshold science. If no specific biomarker existed they… Read more »
‘Dynamic diagnostic relationism’
Is that just a fancy way of saying that the value of a test is dependent on where you think the course of the illness (untreated or treated) is at the time you ordered it?
I suspect most clinicians would be cognisant of that principle whether they were involved in acute or chronic medicine.
Yeah, absolutely. So the pre-test probability balances the target classes (probability of not having disease isn’t overwhelming probability of having disease) probably based on the patient’s history or symptoms or previous tests or something, which makes the -/+LR approach valid since the target classes are more balanced. As Smith pointed out, that approach is appropriate in a hospital setting where the physician determined that the patient has a decent likelihood of having the disease, but not in screening for disease in a low-prevalence population, correct?
I learned today that precision is referred to as PPV in medicine, ha ha.
For a single test in isolation, I would agree that a +/- LR is only useful if there’s a reasonable pretest probability, as described would be frequently the case in a hospital setting. However tests can also be chained together using the first test’s posttest probability for the next test’s pretest probability (this does make the assumption the tests are 100% independent of one another). For screening, a disease (I don’t have a good example off the top of my head) might have a very low risk/cost test and a higher risk/cost test. The first could be used for screening… Read more »
Sounds reasonable. The only situation where -LR might mislead would be if the population’s disease prevalence was really high, but that seems unlikely to happen, ha ha.
Then it may very well be possible you have reached the decision threshold to treat or not treat without needing to order the test at all!
What a wild thought. Clinical medicine.
Just my two cents: In statistical/machine learning model evaluation, the popular metrics to use are precision (PPV in medicine, apparently) and recall (or sensitivity). When a model performs well in both precision and recall, then the model does well regardless of the class imbalance, which is convenient. Some popular measures to combine the two metrics are the F1 measure (harmonic mean of precision and recall – in some versions, you can attach a weight to precision/recall if you value one of the metrics more than the other), or a precision-recall receiver operating curve, if you wanted to decide what threshold… Read more »
Thanks Josh, Your graph was an elegant way of demonstrating the graphical relationship between sensitivity, specificity, likelihood ratios and the ROC curve. I always had a sneaking suspicion that the SpIN and SnOUT mnemonic didn’t always hold true but hadn’t paid to much thought to the mathematics of it all. However, it is now obvious from surveying your graph that the conditions to which these ‘rules’ apply is when the complementary parameter is >90%. SpIN is true if sensitivity is >90%. SnOUT is true if specificity > 90%. It breaks down considerably when either sensitivity or specificity of the test… Read more »
I’ve realised I made an error in reading your graph. SpIN is true (for all values of sensitivity) as long as Specificity > 90%. SnOUT is true as long (for all values of specificity) as long as Sensitivity is >90%.
Except when the patient’s pre-test probability of having the disease is low for SpIN. 😉
I think you are describing positive predictive value
Beyond the mathematics of how information interacts to provide us estimates of the probability of the presence or absence of disease, the decision to act on it is also dependent on the consequences of intervening or not e.g. missing an unstable C-spine fracture is different from missing a fractured nose.
I suspect most variability in clinical practice amongst experts isn’t due to a gross miscalculation of the probabilities but the degree to which the individual clinician perceives as an acceptable level of risk or benefit. e.g. stroke lysis
Very interesting and well said. However, I think it falls into the same reductionist trap that most of these discussions find. Almost no test has much decision-making value alone, except for some of the real decerebrate powerhouses (CT scans and the like). Most of the meaningful diagnoses we make are based upon a constellation of findings, from all the little twinkles in a history and physical exam (and surely, each time you inspect or palpate a toe, you are performing a test however small) to each row and column of the diagnostic studies. Statistically we try to model this by… Read more »
Yes but the feature missing from most discussion of sens./spec and LR is TIME. In many cases a test actually does not have “an LR”. In fact, the LR is often a function of the state of the condition and this may even be a declining function. “In many cases the LR is a function, not a number.” The LR of the WBC and the LR of the band percentage were diagnostically synergistic functions of the time state of sepsis. Tests for which the LRs are diagnostically synergistic functions should generally be ordered together. Once again, a test thresold does… Read more »
see that many do not understand how the sensitiv8ty, specificity, as LR are each functions of time. Let me provide an example. Suppose we determine, using a large trial that the sens and spec of a platelet count of 100 for sepsis (this is the arbitary cutoff selected by experts in Sepsis 3). Are those results reliable and reproducible —NO, not without knowing the parameters defining the baseline platelet counts and the slopes of the platelet counts of the cases under test. Why? …The reason this is required is we are using a test which is an equisite function… Read more »
So forget the math, what does this mean at the bedside. 1. The earlier a physcian suspects sepsis and orders the tests of Sepsis 3, the more likely the tests will fail to meet threshold values and be falsely negative.. Failure to order a follow-up set of tests on such cases will be catastrophic if reliance is placed on Sepsis 3. 2. The later a physical suspects and orders a WBC to determine the presence or absence of a severe infection, the more likely it will be a false negative (normal test). Reliance on the WBC and Failure to order… Read more »
Same as when you try to diagnose rheumatoid arthritis with a rheumatoid factor
Hmm. ..
Well I am not sure the RF often normalizes as rheumatoid arthritis severity and duration increases as the WBC count often does in sepsis, but I could be convinced with a good reference.
It is not possible to have a sensitivity or specificity less than 50%. If the calculated specificity or sensitivity is less than 50% then the test should be interpreted in the opposite direction and the spec/sens recalculated as (100-calculated). Similarly, it is not possible to have a LR+ less than 1 nor a LR- greater than 1.
Haha exactly what i was coming to say!
If one has a Se=.01 and Sp=0.1, the test is hardly in the “bullshit zone”, its actually a phenomenal test that needs the signs flipped.
The opposite of a LR of 12 isnt a LR of .01 (or -5…), its a LR of 1.
please see footnote #3.
it is possible to have a sensitivity & specificity <50%
you have to be dumb to design a test this way, but it is mathematically possible
my next posting (july 4) will feature a commonly used physical exam sign which is useless when used as typically recommended, but can be flipped around to have an inverse significance which is useful.
Predictive values are affected by a) prevalence and b) test parameters. The dummy numbers are not weighted for typical clinical scenario. If the prevalence of disease differ by a multiple of ten (or even five), which is not unusual in ICU settings where CT angio (lets say) don’t have PE, you might find the thumbrule works well. But I agree that it is only meant under usual assumptions, which is not taught that well. We overestimate settings in which clinical hunch makes it “50-50”. There are hardly any aa biases fade negative observations.
A test does not have a given sensitivity and specificity, but any number of sensitivities and specificities depending on the cut-off value at which the test is deemed positive or negative. For example, a D Dimer cut-off of 0.5 is usually chosen as a balance between making the test sensitive (no false negatives) without making it too non-specific (too many false positives). Decreasing the cut-off value to 0.4 increases the sensitivity but decreases the specificity; increasing the cut-off value to 0.6 increases the specificity but decreases the sensitivity…sensitivity and specificity are imprecise measurements of the ‘ability’ of a test because… Read more »