
Based on the Rivers trial of early goal-directed therapy, central venous oxygen saturation (cvO2%) emerged as a resuscitation target. This was recommended for over a decade until the PROCESS, PROMISE, and ARISE trials demonstrated that cvO2% monitoring was unnecessary. Consequently, this has largely fallen by the wayside.
However, one niche role of cvO2% in the ICU has persisted. cvO2% continues to be checked occasionally with a goal of trying to sort out which type of shock a patient has. The rationale is that high-output shock states (e.g. sepsis, anaphylaxis) should increase the cvO2%, whereas low-output shock states (e.g. cardiogenic, hemorrhagic) should reduce the cvO2%. This concept has a certain physiologic appeal and has been advocated by some authors (Gattinoni 2013).
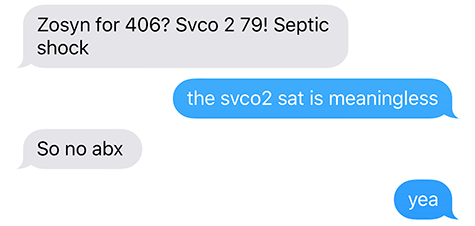
Recently a few cases at Genius General Hospital have arisen where cvO2% was misleading. Specifically, the cvO2% was elevated despite cardiogenic or hemorrhagic shock. This post will attempt to explore why this might occur.
Physiologic rationale for using cvO2% to monitor cardiac output
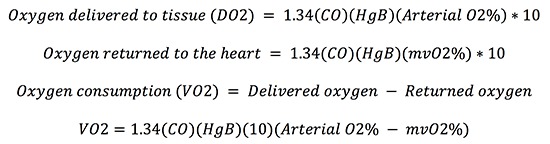
This starts with the Fick equation, which may be derived as follows (where mvO2% is the mixed venous saturation as measured in the pulmonary artery)(5).
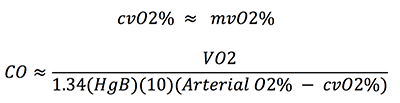
This equation can be rearranged to allow calculation of the cardiac output (CO) based on the mixed venous oxygen saturation:

This is how the cardiac output may be calculated using the mixed venous oxygen saturation (e.g. using a pulmonary artery catheter). If we make the approximation that cvO2 is close to mvO2%, then cvO2% could likewise used to estimate cardiac output:
 This is the basis of using the cvO2% to differentiate shock states, because in theory it should reveal whether the patient is in a high-output or low-output shock state.
It's impossible to determine if the cardiac output is high or low by simply looking at the cvO2%
I used to believe that looking at the cvO2% could allow you to tell whether the cardiac output was elevated (cvO2% >70%) or reduced (cvO2% <70%). However, it's easy to show that this is wrong. The first step here is to recognize one error in the above Fick calculation, in the first line of the derivation:
![]()
The oxygen delivered to the tissue is provided by both oxygen bound to hemoglobin and oxygen dissolved directly in the plasma. Under normal conditions, the amount of oxygen dissolved in the plasma is negligible compared to the oxygen bound to hemoglobin. However, the ICU isn't a state of physiologic normalcy. If patients have low hemoglobin (e.g. HgB 6 mg/dL) and are on 100% FiO2 then a significant amount of delivered oxygen may be in the dissolved form (~15%). This has been confirmed clinically: Legrand 2014 showed that increasing from 40% FiO2 to 100% FiO2 increased the cvO2% an average of 13%! A more precise formula is thus:
![]()
Using this equation to re-derive Fick's equation yields the following equation:

The length of this equation indicates that the relationship between cvO2% and cardiac output is complex. To provide a sense of the impact of different variables, below are some examples of hypothetical patients illustrating how variables can affect cvO2%:
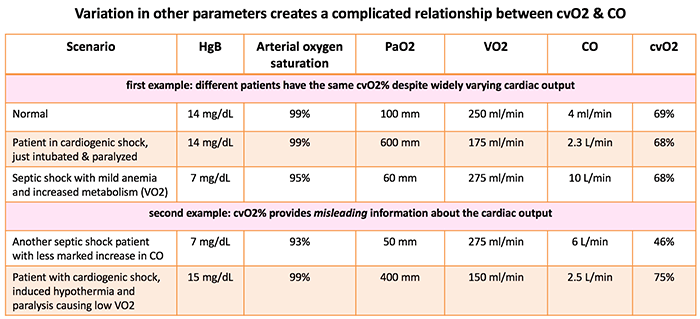
Thus, it should be clear that there is no simple relationship between cvO2% and cardiac output:
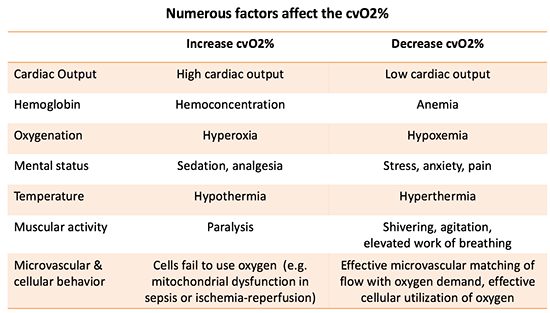
Another way to illustrate this is simply to list the factors which affect cvO2% (table below; Bloos 2005). Based on the numerous factors involved, it should be clear that no simple relationship exists between cvO2% and cardiac output. Indeed, an array of variables is involved in a veritable tug-of-war, with each variable tugging the cvO2% in a different direction.
It's impossible to determine the cardiac output even by calculating it.
Very well, so it's impossible to know the cardiac output from looking at cvO2%. But what if we get more sophisticated? First, we could stop giving patients excessive amounts of FiO2 and PaO2 (avoiding hyperoxia is good practice anyway). This would get rid of the PaO2 term, allowing us to use a traditional Fick equation as shown below. Second, we could calculate the cardiac output from this equation, allowing us to account for variables such as hemoglobin and arterial oxygen saturation. Would that allow calculation of the cardiac output?

This takes us a step closer to the truth, but many sources of error remain:
- Most clinicians don't have the ability to measure VO2 at the bedside. This forces a VO2 estimation, which is very imprecise (with wide variation in VO2 depending on differences in temperature, paralysis, nutrition, and sedation).
- The central venous oxygen saturation is a poor estimator of the actual mixed venous oxygen saturation. For example, one study comparing cvO2% vs. mvO2% in sepsis found that the 95% confidence interval for the difference between both values was between -12% and 15.5%:

The composite impact on these errors upon the error of the calculated cardiac output may be estimated using multivariable calculus (where aO2% represents the arterial oxygen saturation):

Let's enter some potential values and see how much error this creates:
- VO2 = 210 +/- 25 ml/min
- HgB = 12 +/- 0.5 mg/dL
- Arterial oxygen saturation = 96 +/- 1%
- Central venous oxygen saturation = 70 +/- 5%
Plugging these values into the formulae above indicates that random error in all four parameters yields a standard deviation of 1.2 liters/minute in the calculated cardiac output. Based on this standard deviation, the 95% confidence interval for the calculated cardiac output would be +/- 2.3 liters/minute (6). This is too imprecise for clinical use.
To verify this math, a Monte-Carlo simulation may be performed. This involves generating values for 5,000 imaginary patients using the values above as well as randomized normal distribution functions (1). This yields a similar albeit slightly higher standard deviation for the calculated cardiac output (1.4 liters/minute)(2). The calculated values of cardiac output are shown here:
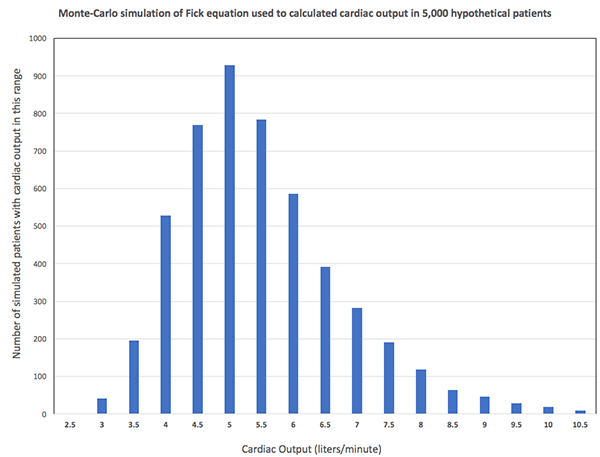
The amount of uncertainty in the example above is actually quite conservative. For example, the error in estimated VO2 is much higher than +/- 25 ml/min among critically ill patients. Based on the Beest data discussed above and other similar studies, the standard deviation of cvO2% might be closer to 8-10%. Therefore, the amount of error likely to occur in the ICU is considerably higher.
The bottom line is that the Fick equation amplifies the amount of random error involved in each of the values entered into it. Even if each individual variable is known with a reasonable margin of error, the calculated cardiac output varies with an unreasonable margin of error. In the ICU we have little idea of what VO2 is and only a rough estimate of mvO2% – so the calculated cardiac output becomes a random number generator (3).

It's impossible to determine the adequacy of systemic oxygenation based on cvO2%.
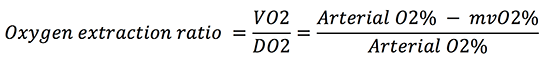
The oxygen extraction ratio is the ratio of the oxygen consumed by the body (VO2) to the oxygen delivered to the body (DO2). A normal oxygen extraction ratio is ~30%. As the amount of oxygen delivered to the body (DO2) decreases, a greater fraction of oxygen will be consumed (higher oxygen extraction ratio). An oxygen extraction ratio >50% is often regarded as reflecting a state of inadequate oxygenation.
Approximating the cvO2% as close to the mvO2% and also approximating arterial O2% as close to 100%, we can obtain:
![]()
This represents a different way that cvO2% may be interpreted, as a measurement of the oxygen extraction ratio:
- cvO2% < 50% suggests inadequate systemic oxygenation (oxygen extraction ratio >50%)
- cvO2% >70% suggests adequate systemic oxygenation (oxygen extraction ratio < 30%)
In some ways this is more accurate than considering cvO2% as a surrogate of cardiac output, because it doesn't require knowing the VO2 or hemoglobin. This may be used as a rationale to target cvO2% > 70% (vis a vis the Rivers Protocol), to ensure adequate systemic oxygenation. Unfortunately, there are several limitations which prevent cvO2% from being an accurate measurement of oxygenation:
- Patients can have high cvO2% despite inadequate oxygenation: cvO2% is a weighted average of the oxygen extraction from different parts of the body. Physiologic shunting of blood past the tissues (e.g. due to sepsis) will tend to elevate the cvO2%. Thus, it is possible for an elevated cvO2% to occur, even if some tissues are experiencing inadequate oxygenation.
- Patients can have low cvO2% despite adequate oxygenation: Some patients with chronic heart failure may compensate with very efficient oxygen extraction (cvO2% ~50-60%) despite not being in a state of shock. Although cvO2% of 70% may represent a population average of “normal,” a lower cvO2% doesn't necessarily indicate clinically significant oxygen deficiency.
Evidence?

This blog has taken a more theoretical approach, due to a lack of direct evidence. Nonetheless, this does appear consistent with available evidence:
- Use of cvO2% as a physiologic target didn't improve outcomes for septic shock resuscitation in the ARISE, PROMISE, or PROCESS trials.
- It is well established in the literature that septic shock may be accompanied by low, normal, or high cvO2% values. Although cardiogenic shock typically causes low mvO2% values, a subset of patients does appear to exist with normal/elevated mvO2% values (Edwards 1991)(4). Therefore, available literature supports the concept that cvO2% cannot differentiate between septic and cardiogenic shock.
Understanding diagnostic tests: signal, noise, and bullshit.
When we evaluate patients, we are continually integrating new data with our pre-conceived notion about what is going on with the patient:

There are roughly three possible scenarios which may be imagined here:
- Signal: The new test result is more accurate than our pre-test conceptualization of the patient. In this case, the added test result will improve our understanding of the patient.
- Noise: The new test result is equally as accurate compared to our pre-test conceptualization of the patient. In this case, the added test result is equally likely to mislead us as it is to push us in the correct direction. On average, the new test result adds nothing.
- Bullshit: The new test is less accurate than our pre-test conceptualization of the patient. In this case, the added information is likely to mislead us.
Studies evaluate the performance of tests in isolation, but this isn't the way tests function in reality. For example, a recent paper suggested that many commonly used clinical decision rules don't outperform the clinician's baseline judgement (Schriger 2016). Although these decision rules look nice in a vacuum, in practice they may not contribute useful information (noise rather than signal).
In order to be useful, a test must significantly out-perform our baseline clinical assessment of the patient.
This rubric may give us a framework to understand cvO2%. cvO2% probably does have some accuracy. For example, a patient with a cvO2% of 40% probably does have a lower cardiac output than a similar patient with a cvO2% of 95%. However, it is doubtful that cvO2% adds anything to our clinical assessment of the patient, especially in the era of bedside echocardiography (for example, the patient with cvO2% of 40% would likely be an an obvious state of low-output shock). Given the considerable inaccuracy of cvO2%, it is possible that it could even be misleading (bullshit).

- It is impossible to estimate the cardiac output merely by looking at the central venous oxygen saturation.
- Even if a Fick calculation is performed which takes other variables into account (e.g. hemoglobin concentration), the central venous oxygen saturation cannot be used to accurately calculate the cardiac output.
- A normal or high central venous oxygen saturation cannot be used to reassure us that the patient has adequate tissue oxygen delivery.
- The central venous oxygen saturation probably cannot contribute useful information for patient evaluation (i.e. information which is more accurate than what could be otherwise surmised based on other clinical parameters).
Notes
- Randomized normal distribution function on Microsoft Excel was used: NORMINV(RAND(),mean,stdev).
- The Monte-Carlo simulation is more accurate, because it's able to take second derivatives and higher-level interaction between variables into account. Nonetheless, both estimates yield the same fundamental answer to the question: the standard deviation of the cardiac output is roughly 1.3 liters/minute, which is too large to be clinically meaningful.
- Magic 8-ball image courtesy of http://www.redkid.net/generator/8ball/. The PulmCrit blog doesn't actually advocate for using a Magic 8-ball for clinical care. However, the Magic 8-ball has been proven to be equivalent and less invasive compared to the PA catheter.
- It should also be noted that cardiac output doesn't always behave as predicted in septic and cardiogenic shock. Patients with sepsis-induced cardiomyopathy may have reduced cardiac output. Alternatively, patients with cardiogenic shock may have some inflammation (due to ischemia/reperfusion or post-cardiac-arrest SIRS), which may tend to reduce the systemic vascular resistance and increase the cardiac output.
- The multiplier of 10 here is needed to convert the arterial oxygen content from ml/dL to ml/L.
- The 95% confidence interval may be estimated as 1.96 multiplied by the standard deviation.

- Pulmcrit wee: The cutoff razor - April 15, 2024
- PulmCrit Blogitorial – Use of ECGs for management of (sub)massive PE - March 24, 2024
- PulmCrit Wee: Propofol induced eyelid opening apraxia – the struggle is real - March 20, 2024
Devil’s advocacy for a few points: 1. Many of these sources of error are mitigated by using trends rather than absolute values. Many of the confounders will not change over short term intervals, yet you can adjust one variable and rapidly observe the effect on ScvO2. (Turn up the dobutamine, watch it increase.) 2. Extraction ratio works the same — a useful trend — even when it does not reach levels of true “hypoxia.” Many of our endpoints are suggestive of compensation rather than decompensation, and this is no different. I was taught that an extraction ratio of about 50%… Read more »
I think we should try to understand the trendings more than an endpoint. To have these parameters obtained at the same patient, on the same scenario (sedated, without pain or excessive o2, etc), always with others parameters, like lactate and Co2 gap, could help to know if your intervention – dobutamine, nora or blood, for example – was beneficcial or not.
While sending 97 % oxygen to perihery why doesn’t extraction ratio exceed 50% oxygen saturatıon .
What are your thoughts on using LVOT VTI instead of ScVO2 or SvO2 to make estimates on CO ?